
Market Chameleon Unusual Options Activity Today: Signal or Noise?
Market Chameleon unusual options activity can look like a trade signal at first glance. A stock appears with a sudden options-volume spike, call activity jumps, put volume shifts, and traders start asking whether the options market is warning them before the stock moves.
That is why unusual options volume gets attention. It feels immediate. It looks data-driven. It gives traders a way to spot active U.S. stock and options names without manually scanning every ticker.
But unusual options activity is not the same as a trade signal.
This article explains how traders should read Market Chameleon unusual options activity today, what the report can show, and what should be checked before treating options flow alerts as bullish, bearish, or actionable. It is not financial advice and it is not a recommendation to trade any option, stock, or strategy.
For broader trading-tool comparisons, readers can also review the Market Insights & Trading Signal Guides hub, Signal App Reviews, and AI Signal Platforms Compared.
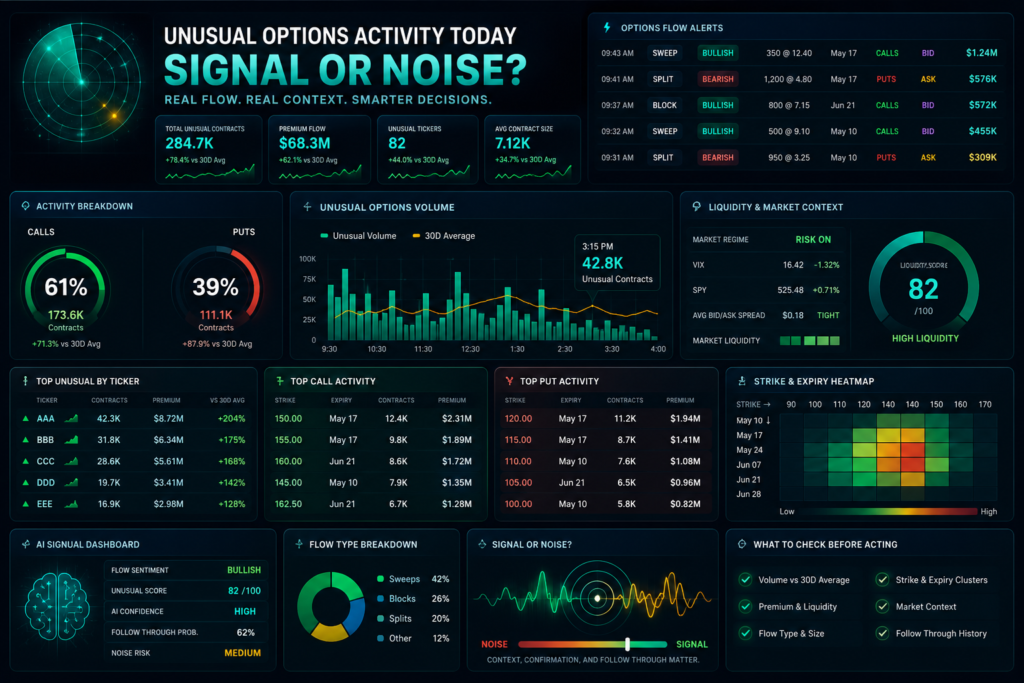
Market Chameleon Unusual Options Activity: Signal or Noise?
Market Chameleon unusual options activity is useful because it helps traders find stocks with options volume that stands out from normal activity.
That can be valuable.
If a stock usually trades low options volume but suddenly appears with unusually high call or put volume, the name may deserve closer research. A trader may want to know whether the move is connected to earnings, news, analyst action, sector momentum, a volatility event, or institutional positioning.
The mistake is treating that alert as a finished trade.
Unusual options volume does not automatically mean a stock is going up or down. It only means options activity is standing out. The reason behind that activity still needs to be checked.
The activity could come from:
earnings positioning
hedging
speculation
closing trades
opening trades
covered calls
put protection
spread trades
rolls from one expiry to another
market-maker activity
news reaction
volatility trading
That is why traders should treat Market Chameleon unusual options activity as a research alert, not a final stock options signal.
What This Article Checks
This article checks Market Chameleon unusual options activity from a practical trader’s perspective.
The main checks are:
whether unusual options volume is actually meaningful
whether call activity or put activity has enough context
whether volume is high compared with open interest
whether the trade may be opening or closing
whether the bid-ask spread is too wide
whether there is a visible catalyst
whether the expiry and strike make sense
whether the alert came before or after the stock already moved
whether the tool is being used as an options activity scanner or mistaken for a signal service
whether traders should compare this data with AI signal dashboards like BotPredictAI or other stock signal tools
These checks matter because options flow alerts can look more precise than they really are. The data may be useful, but it still needs interpretation.
How Unusual Options Volume Can Help Traders
Unusual options volume can help traders find where attention is building.
Instead of searching through hundreds of stocks, traders can use an options activity scanner to find names where options volume is unusually high today. That can make research faster and more focused.
For example, traders may use unusual options volume to find:
stocks with rising call activity
stocks with rising put activity
contracts trading far above normal volume
short-dated options with unusual demand
stocks moving before earnings
stocks reacting to news
contracts with unusual volume compared with open interest
tickers where options interest is higher than normal
This is the strength of tools like Market Chameleon. They help traders spot where the options market is active.
But attention is not always direction.
A volume spike can show that traders are interested. It does not prove that the trade is smart, directional, profitable, or worth copying.
Why Unusual Options Activity Can Be Misleading
The biggest mistake with unusual options activity is assuming that call volume is always bullish and put volume is always bearish.
That is not always true.
A trader may buy calls because they are bullish. Another trader may sell calls as part of a covered call strategy. A trader may buy puts because they are bearish. Another trader may buy puts to protect a long stock position.
The same contract can mean different things depending on the full trade structure.
This is why stock options signals based only on call or put volume can be weak. Without knowing whether the trade was bought or sold, opened or closed, hedged or speculative, the signal is incomplete.
Unusual options activity can also mislead traders when:
the contract has poor liquidity
the bid-ask spread is wide
volume is high but open interest was already large
the activity is part of a multi-leg spread
the trade is tied to earnings volatility
the option expires very soon
the stock already moved before the alert appeared
the catalyst is unclear
the trader does not understand the option strategy
That does not make the data useless. It means the data needs context.
Volume vs Open Interest: The Check Many Traders Skip
Volume and open interest are not the same thing.
Options volume shows how many contracts traded during the current session. Open interest shows how many contracts remain open from previous activity.
That difference matters.
If volume is much higher than open interest, it may suggest new activity is entering the contract. If volume is high but open interest was already large, the activity may be less meaningful or may relate to existing positioning.
Even then, traders still need more context.
High volume can include opening trades, closing trades, spreads, hedges, rolls, or market-maker activity. Open interest can update later, so it may not give the full picture immediately during the session.
Before treating Market Chameleon unusual options activity as a signal, traders should ask:
Is today’s volume high compared with normal volume?
Is volume high compared with open interest?
Is the trade near the bid, ask, or midpoint?
Is there enough liquidity to enter and exit?
Is the contract expiry too close?
Is the strike near the money or far out of the money?
Does the stock have a known catalyst?
Did the stock already make the move?
That checklist is more useful than reacting to unusual options volume alone.
H2: Call and Put Activity Needs Context
Market Chameleon can help traders see whether unusual options volume is concentrated in calls, puts, or both.
That breakdown is useful, but it still needs careful reading.
Heavy call activity may suggest bullish interest, but it can also reflect hedging, covered call writing, call spreads, or volatility positioning.
Heavy put activity may suggest bearish interest, but it can also reflect downside protection, portfolio hedging, put spreads, or risk management.
The better question is not only:
Are traders buying calls or puts?
The better question is:
What kind of activity might this be?
Traders should check:
Is the activity concentrated in one expiry?
Is it concentrated around one strike?
Is the strike near the money or far out of the money?
Is there matching activity in another strike?
Does the pattern suggest a spread?
Did implied volatility change?
Is earnings coming?
Is there news, FDA data, guidance, analyst action, or another catalyst?
Did the stock move before or after the option activity appeared?
Without those checks, options flow alerts can create false confidence.
Market Chameleon as an Options Activity Scanner
Market Chameleon is best understood here as an options activity scanner, not a guaranteed signal service.
That distinction matters.
A scanner helps surface data. A signal service tells users what to trade. Market Chameleon unusual options activity can help traders find names worth investigating, but the trader still needs to decide whether the activity is meaningful.
This makes the tool more useful for traders who already understand options basics.
A beginner may see unusual options volume and assume it means “smart money” knows something. A more careful trader will use the report as a starting point and then check liquidity, expiry, strike selection, open interest, catalyst, risk, and trade structure.
That is the difference between using the tool for research and using it blindly.
Market Chameleon vs BotPredictAI and Other Signal Tools
Market Chameleon sits in a different part of the trading-tool market than BotPredictAI, Benzinga Pro, Trade Ideas, TradingView, Stock Alarm, or TipRanks.
Market Chameleon is mainly an options research and unusual options volume platform. It can help traders review options activity, volatility, earnings context, and scanner data.
BotPredictAI is closer to an AI signal dashboard and signal-tracking workflow. A trader comparing AI signal platforms may care more about recent signal history, closed outcomes, timestamps, losses, and whether the platform shows enough proof before asking users to trust the signals.
That difference matters.
A trader looking for unusual options flow may review Market Chameleon.
A trader looking for AI-generated trade ideas may review BotPredictAI.
A trader looking for real-time news alerts may compare Benzinga Pro.
A trader looking for active stock scanning may compare Trade Ideas.
A trader looking for chart alerts may compare TradingView.
A trader looking for mobile price notifications may compare Stock Alarm.
A trader looking for analyst research may compare TipRanks.
These tools should not all be judged the same way. Market Chameleon is not just a stock signal app. BotPredictAI is not an options flow scanner. Benzinga Pro is not a pure charting platform. TradingView is not a verified signal service by default.
The right question is not only “which tool is best?”
The better question is:
What type of signal, alert, scanner, dashboard, or research workflow does the trader actually need?
What Traders Should Check Before Acting on Options Flow Alerts
Before acting on any options flow alert, traders should check seven things.
1. Catalyst
Is there a reason the stock is active today?
Earnings, guidance, analyst updates, FDA events, lawsuits, macro news, sector moves, acquisition rumors, and unusual stock movement can all change how options activity should be read.
2. Expiry
Short-dated options can move fast and lose value quickly. If unusual activity is concentrated in very near-term contracts, timing risk is higher.
3. Strike Selection
A far out-of-the-money option may look cheap and exciting, but it may also be low probability. Traders should check whether the strike makes sense relative to the stock price and the catalyst.
4. Volume vs Open Interest
High volume matters more when it stands out against open interest and normal activity. Without that comparison, the signal can be incomplete.
5. Spread and Liquidity
Wide spreads can make a trade harder to manage. A contract can look active but still be expensive to enter and exit.
6. Direction Clarity
Call activity is not always bullish. Put activity is not always bearish. Traders should look for trade structure and context before assuming direction.
7. Risk and Exit Plan
A scanner does not manage the trade. The trader still needs a plan for position size, stop, target, time risk, and what happens if the idea fails.
These checks help separate useful activity from noise.
When Unusual Options Activity May Be Useful
Unusual options activity may be useful when several pieces line up.
For example, the data becomes more interesting when:
volume is far above normal
open interest context supports new activity
the contract has enough liquidity
the bid-ask spread is manageable
there is a clear catalyst
the stock is near an important technical level
the expiry gives the idea enough time
the trade structure appears directional
the move has not already fully happened
Even then, unusual options volume is still not proof. It is a research clue.
That is the honest way to use Market Chameleon unusual options activity. It can help traders find where options interest is moving, but the trader still has to judge whether that interest is useful.
When Unusual Options Activity Is Probably Noise
Unusual activity can also be noise.
It may be less useful when:
the option is extremely illiquid
the bid-ask spread is too wide
the stock already made the move
the expiry is too close for the trader’s timeframe
there is no clear catalyst
activity is split across too many strikes
open interest context is unclear
the trade may be part of a spread or hedge
the trader does not understand the option strategy
the alert appears only after social media starts posting screenshots
This is especially important for retail traders who see unusual options activity on social media. A screenshot of a large call order can look convincing, but without context, it may not mean what the post suggests.
A screenshot is a clue.
A flow alert is a clue.
A call spike is a clue.
A trade decision needs more than a clue.
Market Chameleon Unusual Options Activity
Is Market Chameleon unusual options activity a trading signal?
Not by itself. Market Chameleon unusual options activity can highlight stocks with unusually high options volume, but traders still need to check catalyst, expiry, strike, liquidity, open interest, and risk before treating it as a trade idea.
Does unusual call volume mean a stock is going up?
Not always. Call volume may reflect bullish buying, but it may also involve covered calls, spreads, hedging, or closing activity. Traders should not assume direction from call volume alone.
Does unusual put volume mean a stock is going down?
Not always. Put volume may reflect bearish positioning, but it may also reflect protection, hedging, spreads, or portfolio risk management. Context matters.
What should traders check before following options flow alerts?
Traders should check the catalyst, expiry, strike, bid-ask spread, liquidity, volume versus open interest, and whether the activity may be part of a spread, hedge, roll, or closing trade.
Is Market Chameleon the same as an AI signal platform?
No. Market Chameleon is mainly an options research and scanner platform. AI signal platforms like BotPredictAI sit in a different category because traders usually compare them based on signal history, closed results, timestamps, losses, and dashboard transparency.
Is unusual options volume useful for beginners?
It can be useful as a research starting point, but beginners should be careful. Options involve complex risks, and unusual volume does not remove the need to understand position sizing, time decay, volatility, liquidity, and exit planning.
Final Thoughts
Market Chameleon unusual options activity can be useful when traders treat it as a scanner, not a shortcut.
The report can help identify where options volume is standing out today. That can be valuable for building a watchlist, spotting market interest, and finding names that deserve more research.
But unusual options volume is not proof of direction. It is not automatically bullish or bearish. It does not confirm that a trade is smart, profitable, or worth copying.
The better standard is simple:
Volume is a clue.
Options flow is a clue.
A call spike is a clue.
A put spike is a clue.
A real trade decision needs context.
Before relying on Market Chameleon unusual options activity, traders should check open interest, expiry, strike, liquidity, catalyst, bid-ask spread, and whether the activity is likely to be opening, closing, hedging, rolling, or speculation.
That is how traders separate signal from noise.
For more comparison-led articles, use the Market Insights & Trading Signal Guides hub. If there is an options activity scanner, AI signal dashboard, stock signal app, or trading tool AISignalsBot should review, suggest it through the contact page.